How we make our maps
The same stretch of central Italy, from the All Roads Lead to Rome map, at three stages. Nothing on a Cartouche map is invented: every line can be traced back to a published source.
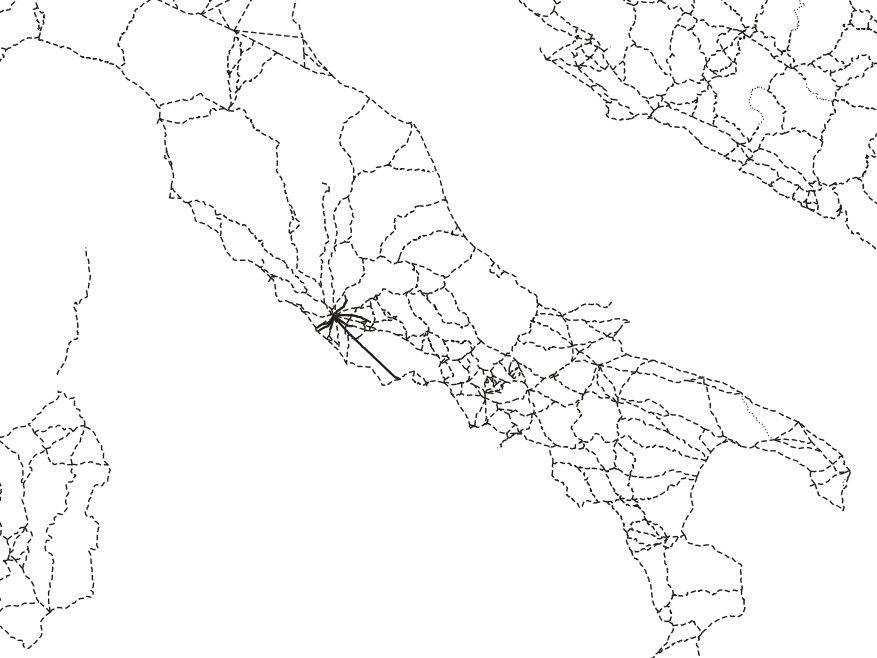
Start from published data
Every map begins with a research dataset, used as published. Here: the Roman roads of central Italy from Itiner-e (de Soto et al., 2025), each segment graded certain (solid), conjectured (dashed) or hypothetical (dotted). We do not add roads, battles or places that are not in the data.
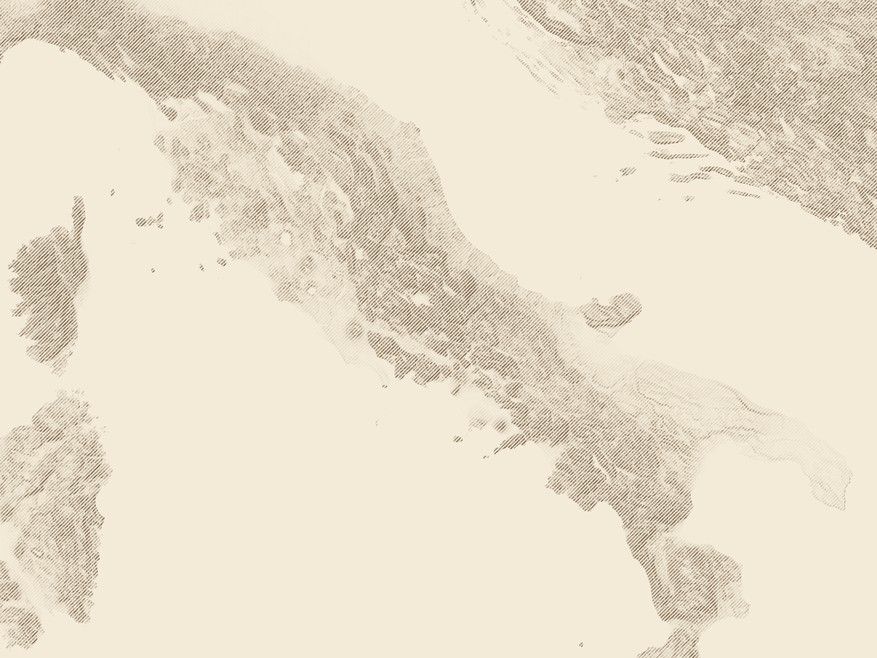
Compute the land
Mountains are hachured from Copernicus satellite elevation data. The hachure strokes are computed from slope and height, not drawn by hand, so every ridge sits where it really is. Coasts, rivers and lakes come from Natural Earth.
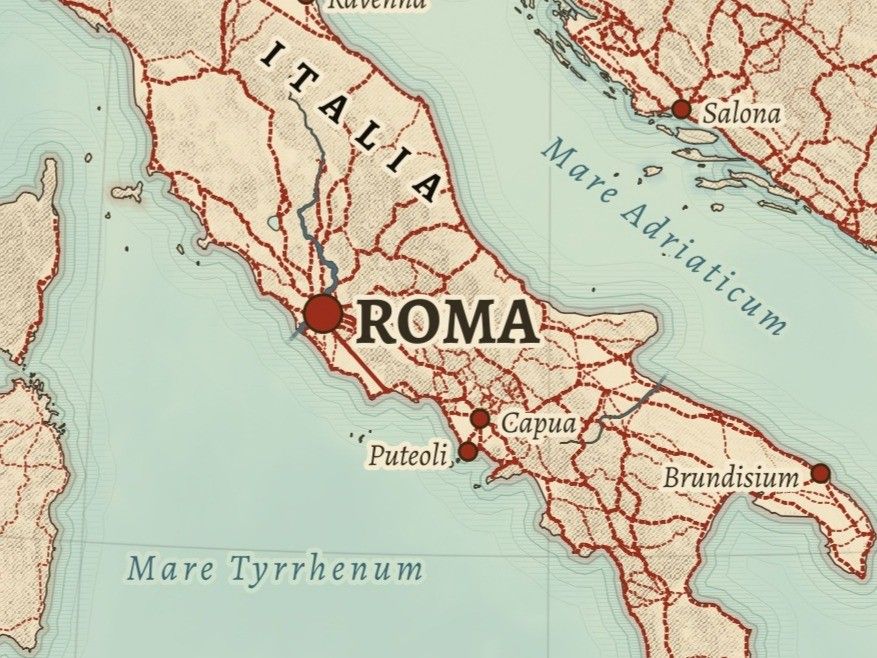
Engrave, name and check
Then the map is set in the manner of an 1889 atlas: period colours, Latin or period names from gazetteers such as Pleiades, labels placed where they read best. Before a sheet goes to print we check close-ups at full print resolution for overlapping names, unlabelled places and figures that do not match their source.
Then it is printed, near you
The finished sheet is exported as a print-ready PDF at 300 dpi and printed to order by our production partner Gelato, on archival matte paper, at a printer close to the delivery address in the United States or Europe.
Every print carries its credits, and every product page lists the exact datasets and licences. The full list is on The Data.
